
How to Audit Your Website With Google Lighthouse
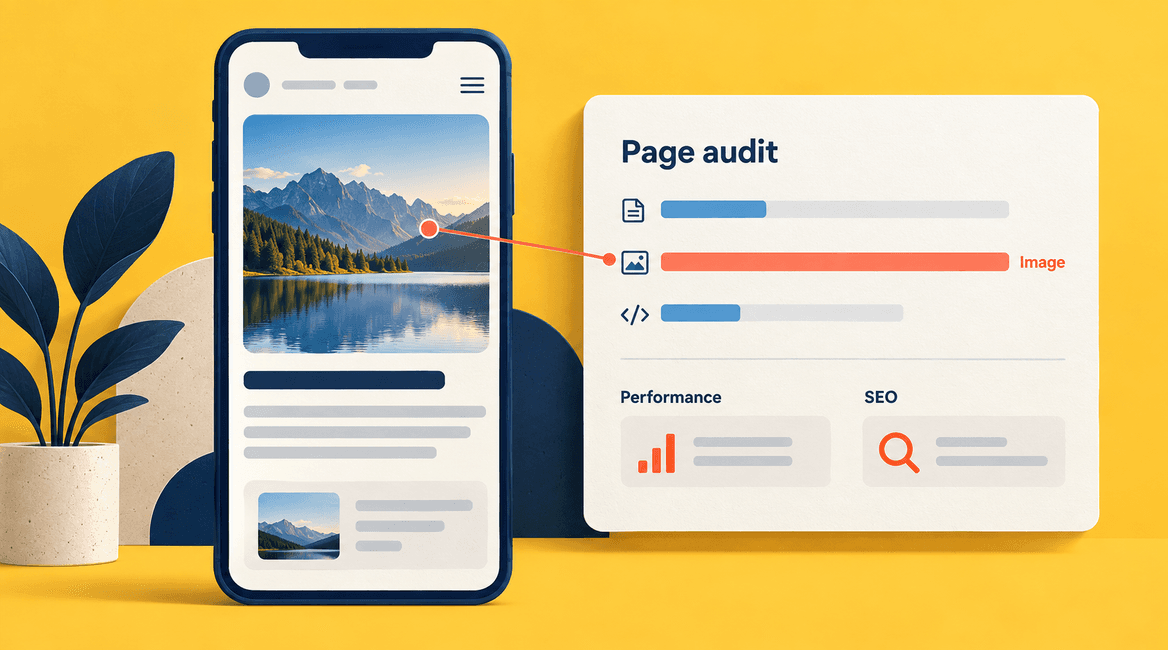
Your website looks quick on your laptop, but a customer says the contact page is slow on their phone. Google Lighthouse can help investigate that difference. It runs automated checks against a page and produces evidence about loading, accessibility, technical practices, and basic SEO.
The report is a starting point, not a complete judgment of the website. A green score cannot prove that customers can finish a task, and a low score does not explain its own cause. This walkthrough shows how to collect a useful baseline, interpret the findings, and decide what to fix first.
A useful audit ends with a reproducible problem and a clear next step, not just a score.

Run an Audit You Can Compare and Act On
Choose representative pages before opening the tool
Audit the pages that represent different work: the homepage, a service page, a blog article, and the main inquiry or booking page. If your site has a logged-in area, test an important screen there separately. One fast homepage cannot establish that every page template performs well.
For each URL, write down its purpose and a simple success condition. A service page should make the offer understandable and allow a visitor to reach the inquiry form. A booking page should load available choices and respond when someone selects one. This keeps the audit connected to actual use.
Run Lighthouse in Chrome DevTools
Open the page in Chrome, open Developer Tools, and select the Lighthouse panel. If it is hidden, look in the additional tools menu. Choose a page-load or navigation audit, select a mobile configuration and the relevant categories, then start the analysis. Labels may vary with Chrome versions. Google's Lighthouse introduction documents the supported workflows.
For a public-page baseline, use a clean browser profile without extensions that alter the page. Close unrelated heavy applications and record the browser version, audit settings, URL, and date. Save the report. Repeat under the same conditions a few times and keep the results together rather than selecting only the highest score.
For an authenticated page, establish the intended session and check the report screenshot afterward. An audit that silently tested the login screen does not measure the dashboard. Review storage-reset settings and keep test accounts free of sensitive production data when sharing reports.
Use PageSpeed Insights for a complementary view
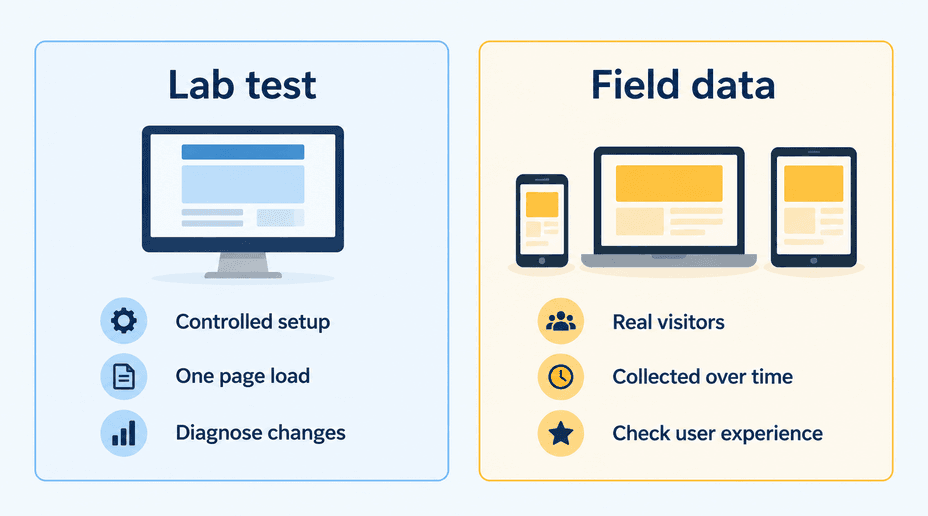
Enter a public URL into PageSpeed Insights to obtain a hosted assessment. It combines Lighthouse lab diagnostics with real-user information from the Chrome User Experience Report when enough data is available. Check whether the real-user section describes the specific URL or the entire origin. Google's PageSpeed Insights guide explains that distinction.
Field data reflects a rolling collection period, so it will not instantly show the effect of a change deployed a minute ago. A newly launched or lightly visited page may have no field data. That is an absence of evidence, not a passing result. Use lab testing to diagnose and verify changes while real-user evidence accumulates.
Read measurements before chasing the score
The performance score summarizes several measurements using a scoring model. It is not the page's load time in seconds, and the listed opportunities do not each subtract a fixed number of points. Conditions such as browser extensions and device load can alter results. See Google's explanation of performance scoring and variability.
Look at the visible loading sequence and the measurements behind the summary. Which important content appeared late? Did the page move after it became visible? Was the main thread busy with JavaScript? Turn each observation into a question that can be investigated rather than treating every warning as an instruction to rewrite the site.
Understand Core Web Vitals without mixing lab and field results
The current Core Web Vitals are Largest Contentful Paint, Interaction to Next Paint, and Cumulative Layout Shift. Google's good-experience thresholds are LCP at or below 2.5 seconds, INP at or below 200 milliseconds, and CLS at or below 0.1, assessed at the 75th percentile of user experiences. Web Vitals guidance explains the metrics and thresholds.
LCP concerns the appearance of the largest qualifying visible content. INP concerns responsiveness across user interactions. CLS concerns unexpected movement. They describe different problems and should not be collapsed into “the website is slow.”
A standard Lighthouse navigation run does not reproduce a visit's full interaction history. Total Blocking Time can help identify main-thread work during loading, but it is not an INP measurement. Test the actual menu, form, or booking interaction as well, and use field or interaction-focused diagnostics where needed.
Follow the evidence to the loading bottleneck
If the report identifies a large hero image as the LCP element, inspect how it is requested and displayed. Is the file unnecessarily large? Is the browser downloading a desktop-sized asset for a narrow screen? Does the request start late because another resource must finish first?
Possible remedies include appropriate dimensions, compression, responsive image variants, and earlier discovery of the important image. Do not automatically lazy-load the main image visible at initial load. Check the network waterfall to see whether the change addresses transfer time, request delay, or something else.
If the page waits before receiving HTML, investigate server response, redirects, and backend work. Compressing a photograph cannot fix a slow database query that delays the entire response. The LCP optimization guide provides a useful way to separate those stages.
Investigate JavaScript and layout shifts separately
For heavy JavaScript work, identify the responsible script or task. A chat widget, analytics package, or large interactive component may load before it is needed. Evaluate removing unused code, loading features when appropriate, and reducing main-thread work. Preserve required behavior and measurement rather than disabling everything to improve a score.
For layout movement, inspect the elements that shift. Images without reserved space, late banners, and font changes can move a button just as someone taps it. Reserve appropriate dimensions and test with realistic content. A stable desktop page can still shift on a smaller screen with longer text.
Record the element, the suspected cause, and the proposed change. “Fix performance” is not an actionable development task. “Reserve the article image's aspect ratio so the heading below it does not move during loading” is.
Website Audit Checklist
- Select representative URLs and identify the primary task on each.
- Record the environment, browser version, device setting, and page state.
- Save repeated baseline runs rather than one favorable score.
- Separate Lighthouse lab results from URL-level or origin-level field data.
- Investigate the resource or interaction behind each important symptom.
- Review SEO and accessibility findings alongside manual checks.
- Assign a specific change, owner, and verification method to each priority.
- Rerun under comparable conditions and retest the visitor journey.
What Lighthouse Can and Cannot Tell You About SEO
Lighthouse's SEO category checks a limited set of technical basics, such as whether the tested page exposes certain crawlable and descriptive elements. Review failed checks individually and confirm the intended behavior of that page. A private account screen and a public service page have different indexing requirements. The SEO audit reference describes the checks.
A perfect SEO score does not establish keyword demand, content quality, backlinks, actual indexing, or ranking position. Use Search Console to inspect indexing and query performance, and assess whether the page answers the visitor's question. Keep Lighthouse as one source of evidence rather than calling it a complete SEO audit.
The same restraint applies to accessibility. Automated findings are useful, but manual keyboard, focus, form-error, and assistive-technology checks remain important. Do not describe an automated pass as proof that every visitor can use the site.
Turn the Report Into a Short Fix List
Imagine a hypothetical service page with a large opening photograph, a chat script, and a form near the bottom. The audit suggests the photograph arrives late and highlights substantial script work. Start by checking which issue affects the content or interaction visitors actually need.
A practical work item could read: “On the mobile service page, inspect the hero-image request, serve an appropriately sized variant, and verify earlier appearance across repeated runs. Confirm that the crop remains correct.” A second could address the chat script only after establishing its contribution and business purpose.
Prioritize broken primary tasks and unintended indexing blocks, then recurring loading and interaction problems on important templates. Group issues with a shared cause. A single image-component improvement may benefit many articles, while a tiny warning on an unused page may have little practical value.
Verify the Change Without Moving the Goalposts
Keep the URL, page state, test settings, and environment comparable. Record the actual metric changes and run-to-run variation. Then manually complete the form or booking process and check that analytics, consent controls, and navigation still behave as intended.
Continue watching real-user performance after release. For major design changes, use the baseline alongside the preparation steps in our website redesign checklist. The result should be a better experience with evidence behind it, not a screenshot of a higher number.
FAQs
Do we need a score of 100?
Treat scores as diagnostic summaries. Improving a slow critical page can be valuable without reaching perfection. Decide what to work on using user impact, measurement evidence, and implementation effort.
Why are mobile and desktop results different?
They use different testing configurations, and the page may serve different layouts or resources. Compare mobile changes against the mobile baseline and desktop changes against the desktop baseline.
Can Lighthouse audit our whole website at once?
A normal run assesses a page. Choose representative templates or use an automated testing setup to cover a defined URL set. It does not replace a site crawl or prove that every route works.
Will speed improvements increase search rankings?
They can improve the experience, but a Lighthouse result cannot predict ranking changes. Search visibility depends on more than loading performance. Measure search outcomes separately from technical audit results.
DevConex can turn audit findings into specific development tasks and verify their effect. Share the pages you want to improve for a focused performance and usability review.